End of Year Stats
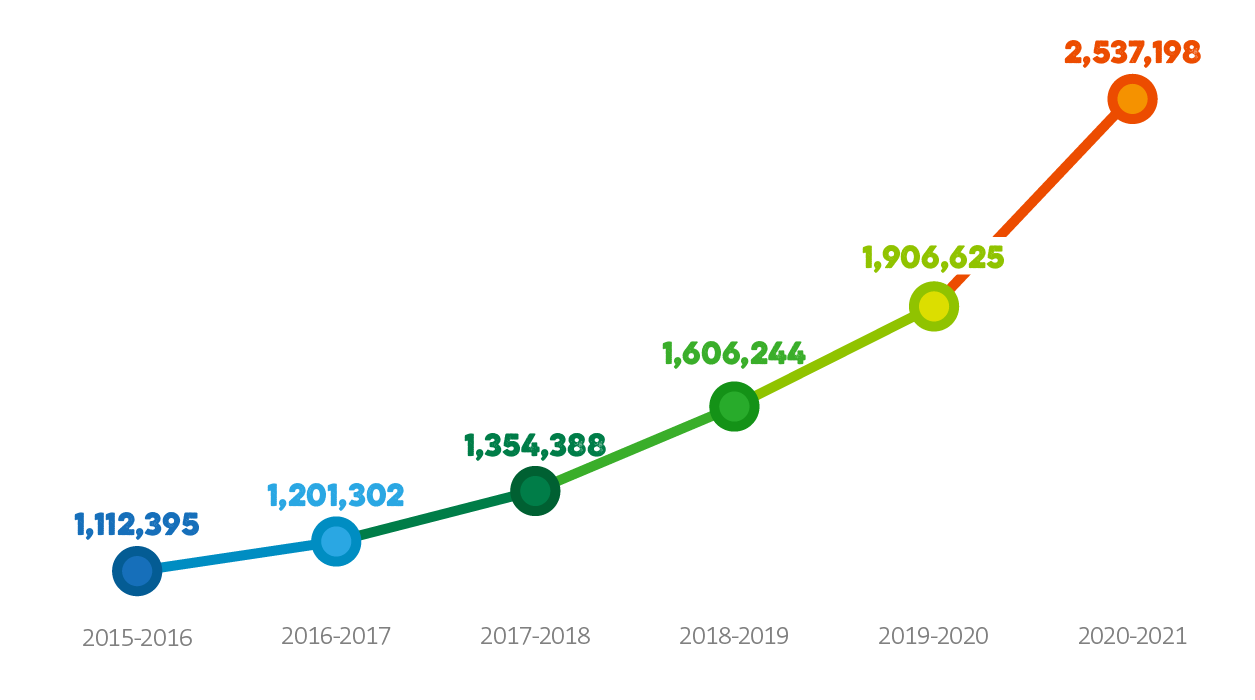
Over the past year food banks in the Trussell Trust network distributed a record 2.5m food bank parcels to people in crisis.
And, because of you we’re able to support food banks in our network deliver this incredible work.
2.5 million
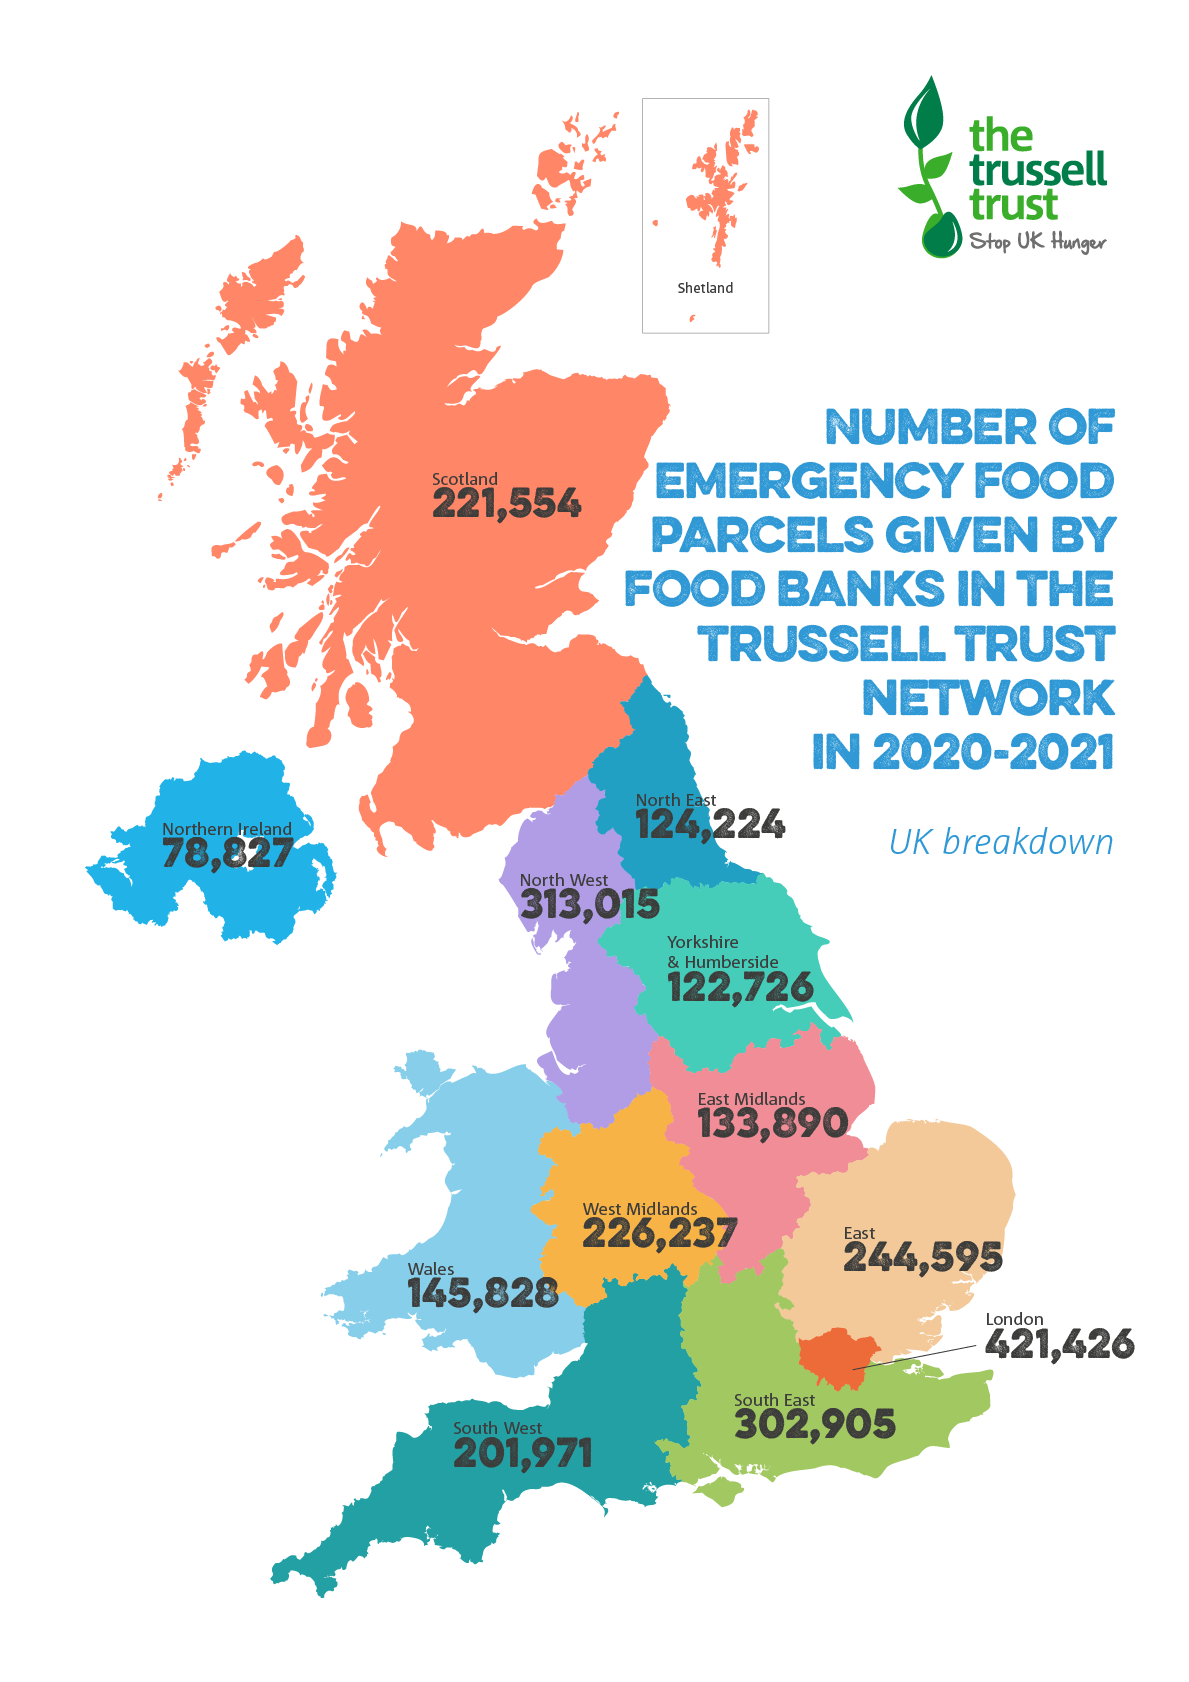
The number of emergency food parcels given to people in crisis by food banks in the Trussell Trust network in the financial year 2020/21.

Between 1 April 2020 and 31 March 2021, food banks in the Trussell Trust’s UK wide network distributed 2.5 million emergency food parcels to people in crisis, a 33% increase on the previous year. A staggering 980,000 of these went to children.
Compared to this time five years ago, need for food banks in our network has increased by 128%.

“No one should face the indignity of needing emergency food. Yet our network of food banks has given out record numbers of food parcels as more and more people struggle without enough money for the essentials. This is not right but we know we can build a better future. This pandemic has shown the unexpected can hit suddenly, but we know when we push for change, united by our desire for justice and compassion, the government has to listen and act.

Emma Revie
Chief Executive
Hunger in the UK isn’t about food. It’s about a lack of income. We know the main drivers of food bank use in our network are:
- Problems with the benefits system (delays, inadequacy and reductions)
- Challenging life experiences or ill-health
- Lack of informal or formal support
| 2014/15 | 2015/16 | 2016/17 | 2017/18 | 2018/19 | 2019/20 | 2020/21 | |
| UK | 1,091,282 | 1,112,395 | 1,201,302 | 1,354,388 | 1,606,244 | 1,906,625 | 2,537,198 |
| England | 866,481 | 863,870 | 920,170 | 1,046,807 | 1,235,892 | 1,488,038 | 2,090,989 |
| Scotland | 119,212 | 135,943 | 150,095 | 173,526 | 217,006 | 238,561 | 221,554 |
| Wales | 87,935 | 86,314 | 97,144 | 100,362 | 116,087 | 134,892 | 145,828 |
| Northern Ireland | 17,654 | 26,268 | 33,893 | 33,693 | 37,259 | 45,134 | 78,827 |
| North East | 88,248 | 76,523 | 62,280 | 65,218 | 89,479 | 98,521 | 124,224 |
| North West | 158,079 | 160,803 | 175,645 | 198,830 | 225,188 | 253,772 | 313,015 |
| Yorkshire & Humberside | 58,939 | 66,303 | 70,307 | 79,502 | 90,245 | 108,148 | 122,726 |
| West Midlands | 104,374 | 103,702 | 111,760 | 121,039 | 142,900 | 169,137 | 226,237 |
| East Midlands | 45,484 | 49,366 | 56,791 | 67,078 | 78,229 | 101,785 | 133,890 |
| East | 102,319 | 103,668 | 116,356 | 130,493 | 157,243 | 190,039 | 244,595 |
| London | 108,373 | 112,124 | 113,701 | 137,923 | 169,734 | 204,187 | 421,426 |
| South West | 100,188 | 93,701 | 104,095 | 121,826 | 133,287 | 163,207 | 201,971 |
| South East | 100,477 | 97,680 | 109,235 | 124,898 | 149,587 | 199,242 | 302,905 |
| 2014/15 | 2015/16 | 2016/17 | 2017/18 | 2018/19 | 2019/20 | 2020/21 | |
| UK | 691,638 | 695,580 | 757,881 | 862,583 | 1,020,733 | 1,183,672 | 1,557,116 |
| England | 541,806 | 534,574 | 575,703 | 660,833 | 916,330 | 913,433 | 1,273,275 |
| Scotland | 82,686 | 91,255 | 100,781 | 117,540 | 157,512 | 156,602 | 144,431 |
| Wales | 57,154 | 54,850 | 61,687 | 64,341 | 83,670 | 83,509 | 91,611 |
| Northern Ireland | 9,992 | 14,901 | 19,710 | 19,869 | 26,160 | 26,074 | 47,799 |
| North East | 52,815 | 46,537 | 39,364 | 41,400 | 62,038 | 61,999 | 78,140 |
| North West | 98,314 | 98,807 | 108,540 | 123,578 | 100,135 | 152,617 | 192,494 |
| Yorkshire & Humberside | 38,207 | 41,918 | 45,340 | 51,206 | 67,243 | 67,219 | 74,987 |
| West Midlands | 64,526 | 64,186 | 70,351 | 77,408 | 106,882 | 106,695 | 137,953 |
| East Midlands | 28,614 | 30,672 | 35,568 | 42,436 | 62,501 | 62,363 | 81,728 |
| East | 65,613 | 64,204 | 71,902 | 80,999 | 113,793 | 117,968 | 142,593 |
| London | 67,010 | 69,044 | 72,170 | 88,998 | 129,323 | 129,424 | 262,436 |
| South West | 63,863 | 59,343 | 65,586 | 76,831 | 100,369 | 99,712 | 122,372 |
| South East | 62,844 | 59,863 | 66,882 | 77,977 | 120,544 | 115,436 | 180,572 |
| 2014/15 | 2015/16 | 2016/17 | 2017/18 | 2018/19 | 2019/20 | 2020/21 | |
| UK | 399,644 | 416,815 | 443,421 | 491,805 | 585,511 | 722,953 | 980,082 |
| England | 324,675 | 329,296 | 344,467 | 385,974 | 456,968 | 571,708 | 817,714 |
| Scotland | 36,526 | 44,688 | 49,314 | 55,986 | 71,430 | 81,049 | 77,123 |
| Wales | 30,781 | 31,464 | 35,457 | 36,021 | 41,756 | 51,222 | 54,217 |
| Northern Ireland | 7,662 | 11,367 | 14,183 | 13,824 | 15,357 | 18,974 | 31,028 |
| North East | 35,433 | 29,986 | 22,916 | 23,818 | 33,277 | 36,483 | 46,084 |
| North West | 59,765 | 61,996 | 67,105 | 75,252 | 83,983 | 100,135 | 120,521 |
| Yorkshire & Humberside | 20,732 | 24,385 | 24,967 | 28,296 | 32,735 | 40,905 | 47,739 |
| West Midlands | 39,848 | 39,516 | 41,409 | 43,631 | 51,231 | 62,255 | 88,284 |
| East Midlands | 16,870 | 18,694 | 21,223 | 24,642 | 29,273 | 39,284 | 52,162 |
| East | 36,706 | 39,464 | 44,454 | 49,494 | 60,489 | 76,246 | 102,002 |
| London | 41,363 | 43,080 | 41,531 | 48,925 | 60,918 | 74,864 | 158,990 |
| South West | 36,325 | 34,358 | 38,509 | 44,995 | 49,505 | 62,838 | 79,599 |
| South East | 37,633 | 37,817 | 42,353 | 46,921 | 55,557 | 78,698 | 122,333 |
What do these stats show?
Our statistics are a measure of volume rather than unique users, the available data indicates that people received around 2.4 food bank referrals in the last year. The data is collected using an online system into which food banks enter data from each food bank voucher, and the number of emergency food supplies is recorded.
For example, if a family of three were referred to a food bank twice in one year, this would count as six supplies on the system because it would reflect six instances of a supply going to someone in the household. However, if a family of three were only referred to a food bank once, this would count as three supplies.
Trussell Trust figures cannot be used to fully explain the scale of food bank use across the UK, because our figures relate to food banks in our network and not to the hundreds of independent food aid providers and community-groups also providing support. There are more than 1,300 food bank centres in the Trussell Trust’s UK wide network. The Independent Food Aid Network (IFAN) represents more than 500 independent food banks operating across the UK. IFAN has identified at least 1,034 independent food banks across the UK in addition to food banks in the Trussell Trust network, Salvation Army, and school-based food banks.
Read our full data briefing here. You can access breakdowns of the data to local authority level here.
